

The longest chain is only as strong as its weakest link. Behind every cloud service is a supply chain working 24/7 to deliver reliability, speed, and scale.
Background and pain points
Cloud supply chain is an emerging field at Microsoft. As it grows into maturity, many business users continues to rely on manual process such as spreadsheet, emails and offline communications for daily operations. They also have to navigate multiple tools and data sources, making it harder to complete work and track progress. All these result in inflated costs and reduced efficiencies, which greatly impact the agility of the supply chain.
My role
As both UX designer and researcher, I partnered with multiple product teams and business owners to design web applications within Microsoft’s supply chain UI platform which becomes the single destination for business operations across the organization. Because there was no dedicated researcher, I also led user research to uncover pain points and validate solutions.
The apps I designed span every part of the supply chain, including cost planning, cloud capacity planning, logistics, deployment, and decommissioning of cloud resources. I also designed external supplier collaboration tools that connect Microsoft supply chain managers with outside partners.
My goal throughout these projects was to deliver user-friendly solutions and intuitive interfaces that not only streamline and automate workflows, but also provide end-to-end insights to support informed decision-making.
Design principles
My role as a designer is to uncover unmet user needs, bring clarity to complex systems, and connect human experience with technology. While each project differs in complexity, scope and focus, these is a set of principles I practice daily and they become an integral part of my design process.
Design thinking starts with empathy and ends with impact
Because supply chain challenges are domain-specific and highly intricate, I rely on empathy, iteration, and a bias toward action to understand user needs and deliver meaningful solutions.
Design is not only how it looks, but how it works.
My work is guided by intentional, research-driven design decisions. I strive to expand my design skills, deepen domain expertise, and explore innovative solutions through experimentation.
Fall in Love with the Problem, Not the Solution
A successful product is not defined by elegant features or architecture alone. It begins with a deep understanding of customers, the problems they face and the goals they want to achieve.
App example 1: Cost planning tool
I built a cost planning tool that streamlines quarterly CapEx preparation. It enables planners to set criteria for which capacity records are considered in quarterly CapEx funding tasks. The tool also provides multiple views of cloud resources and the total CapEx amount before submission to the CapEx Council for approval.
Updated user work flow
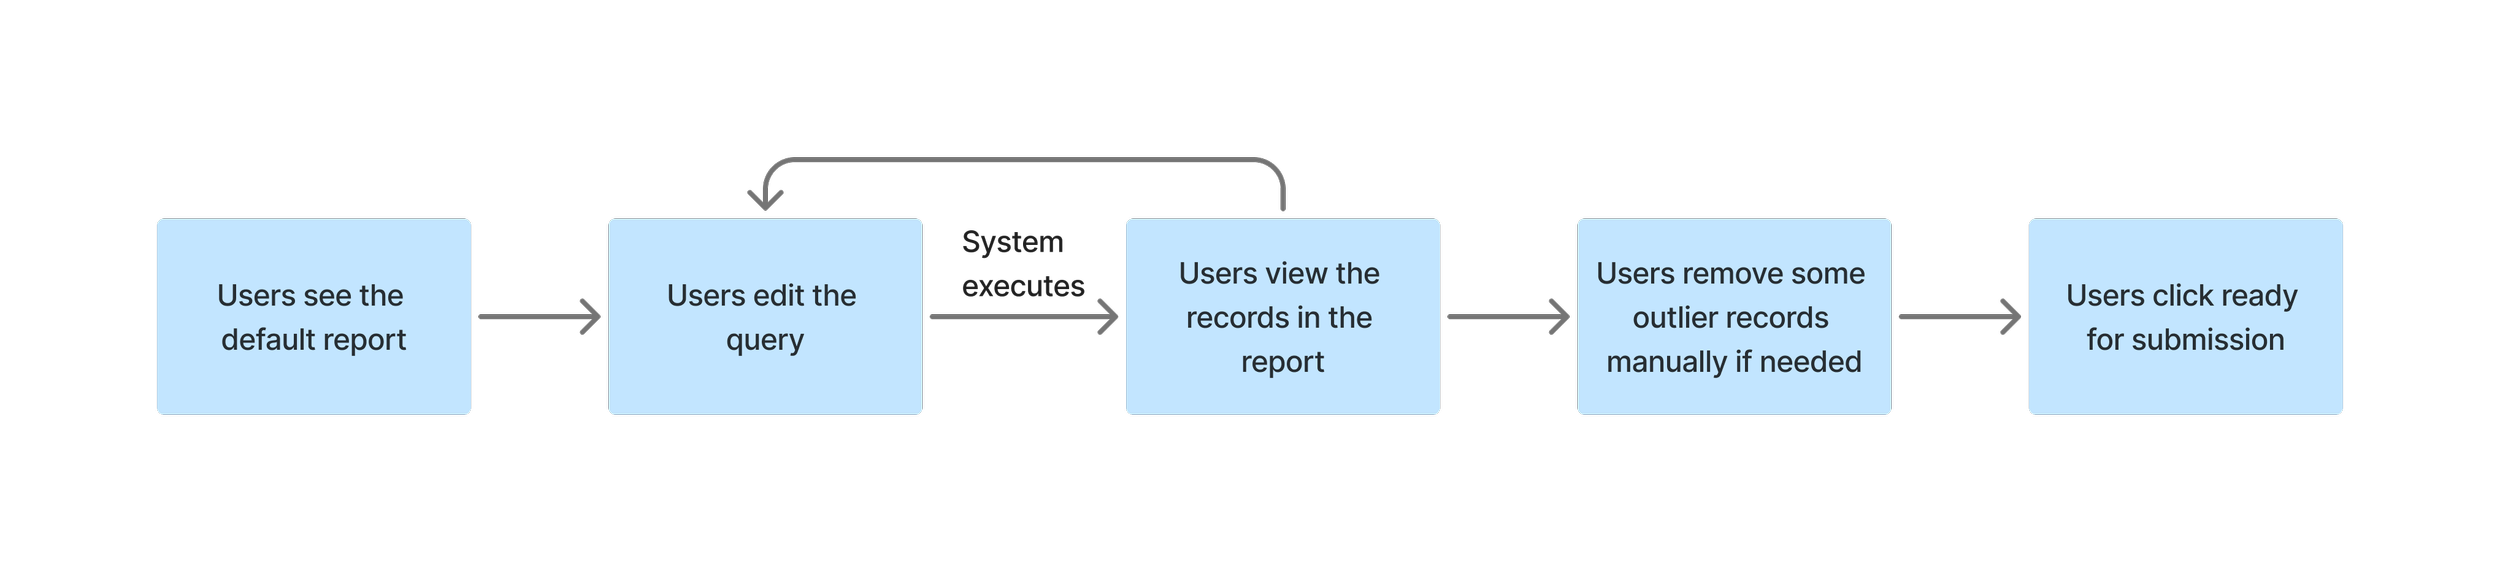
The updated workflow illustrates how CapEx planners interact with the redesigned cost planning tool.
Final Deliverables (Prototype in Figma)
As the final stage, I created high-fidelity designs and an interactive Figma prototype. The prototype shown here brings the CapEx workflow to life, allowing stakeholders to experience the streamlined process and the finished UI.
App example 2: Server reuse for sustainability
Background
There is a growing list of internal Microsoft groups that prefer to reuse server assets rather than purchase new hardware. Currently the decommission pipeline contains assets worth hundreds of millions that could be repurposed internally. This presents a major cost-saving opportunity, while also supporting Microsoft’s 2030 carbon negative goal and circular economy initiatives.
Define MVP
Working with the product manager, I helped define the scope and release plan. If we make the program available for all the business groups inside of Microsoft, we need to build a very complicated system to connect information across different organizations, which will require significant resource. Instead, we proposed a lightweight MVP to gauge interest and validate product viability before scaling further.
Target Users
We decided to target our MVP to a business operation team that manages server requests for engineering groups. Much of their work involves manually monitoring server lifecycles and coordinating asset transportation. Having a tool like this will streamline their tasks and deliver immediate value. Because they did not require additional approval, it helps minimize scope and let us focus on the key scenarios.
Final Deliverables (Prototype in Figma)
The final deliverables include high-fidelity screens and an interactive prototype built in Figma. The prototype below demonstrates the updated workflow and final UI design for the server reuse initiative.
App example 3: Cloud capacity dashboard
Before this project, capacity managers relied on multiple disconnected tools to assess customer capacity health. These siloed tools often suffered from issues with accuracy, scalability, security, and performance. To align with Microsoft’s mission of delivering the best cloud capacity experience, this project consolidated capacity-related data from across sources into a single platform, presenting it in a clear and consumable way.
User pain points
Lost of Context
Data was scattered across tools, forcing users to switch constantly. This disrupted workflow, caused loss of context, and added extra setup.
No Single Source of Truth
When discrepancies appeared, there was no reliable way to know which dataset to trust, leaving users uncertain and slowing critical decision-making.
Inconsistent Visualizations
Different tools used different visual styles, making it time-consuming and difficult for users to interpret, compare data, and draw reliable insights.
Guidance on design decision
Clarity over novelty
When choosing between different data visualization, I prioritized straightforward, easy-to-read visualizations over novel or overly complex ones.
Consistency
The page layout will be consistent across different sections to achieve a unified experience and reduced cognitive load.
Simplify
I used familiar design patterns like filters, overlays, and carousels to streamline workflows and remove unnecessary complexity.
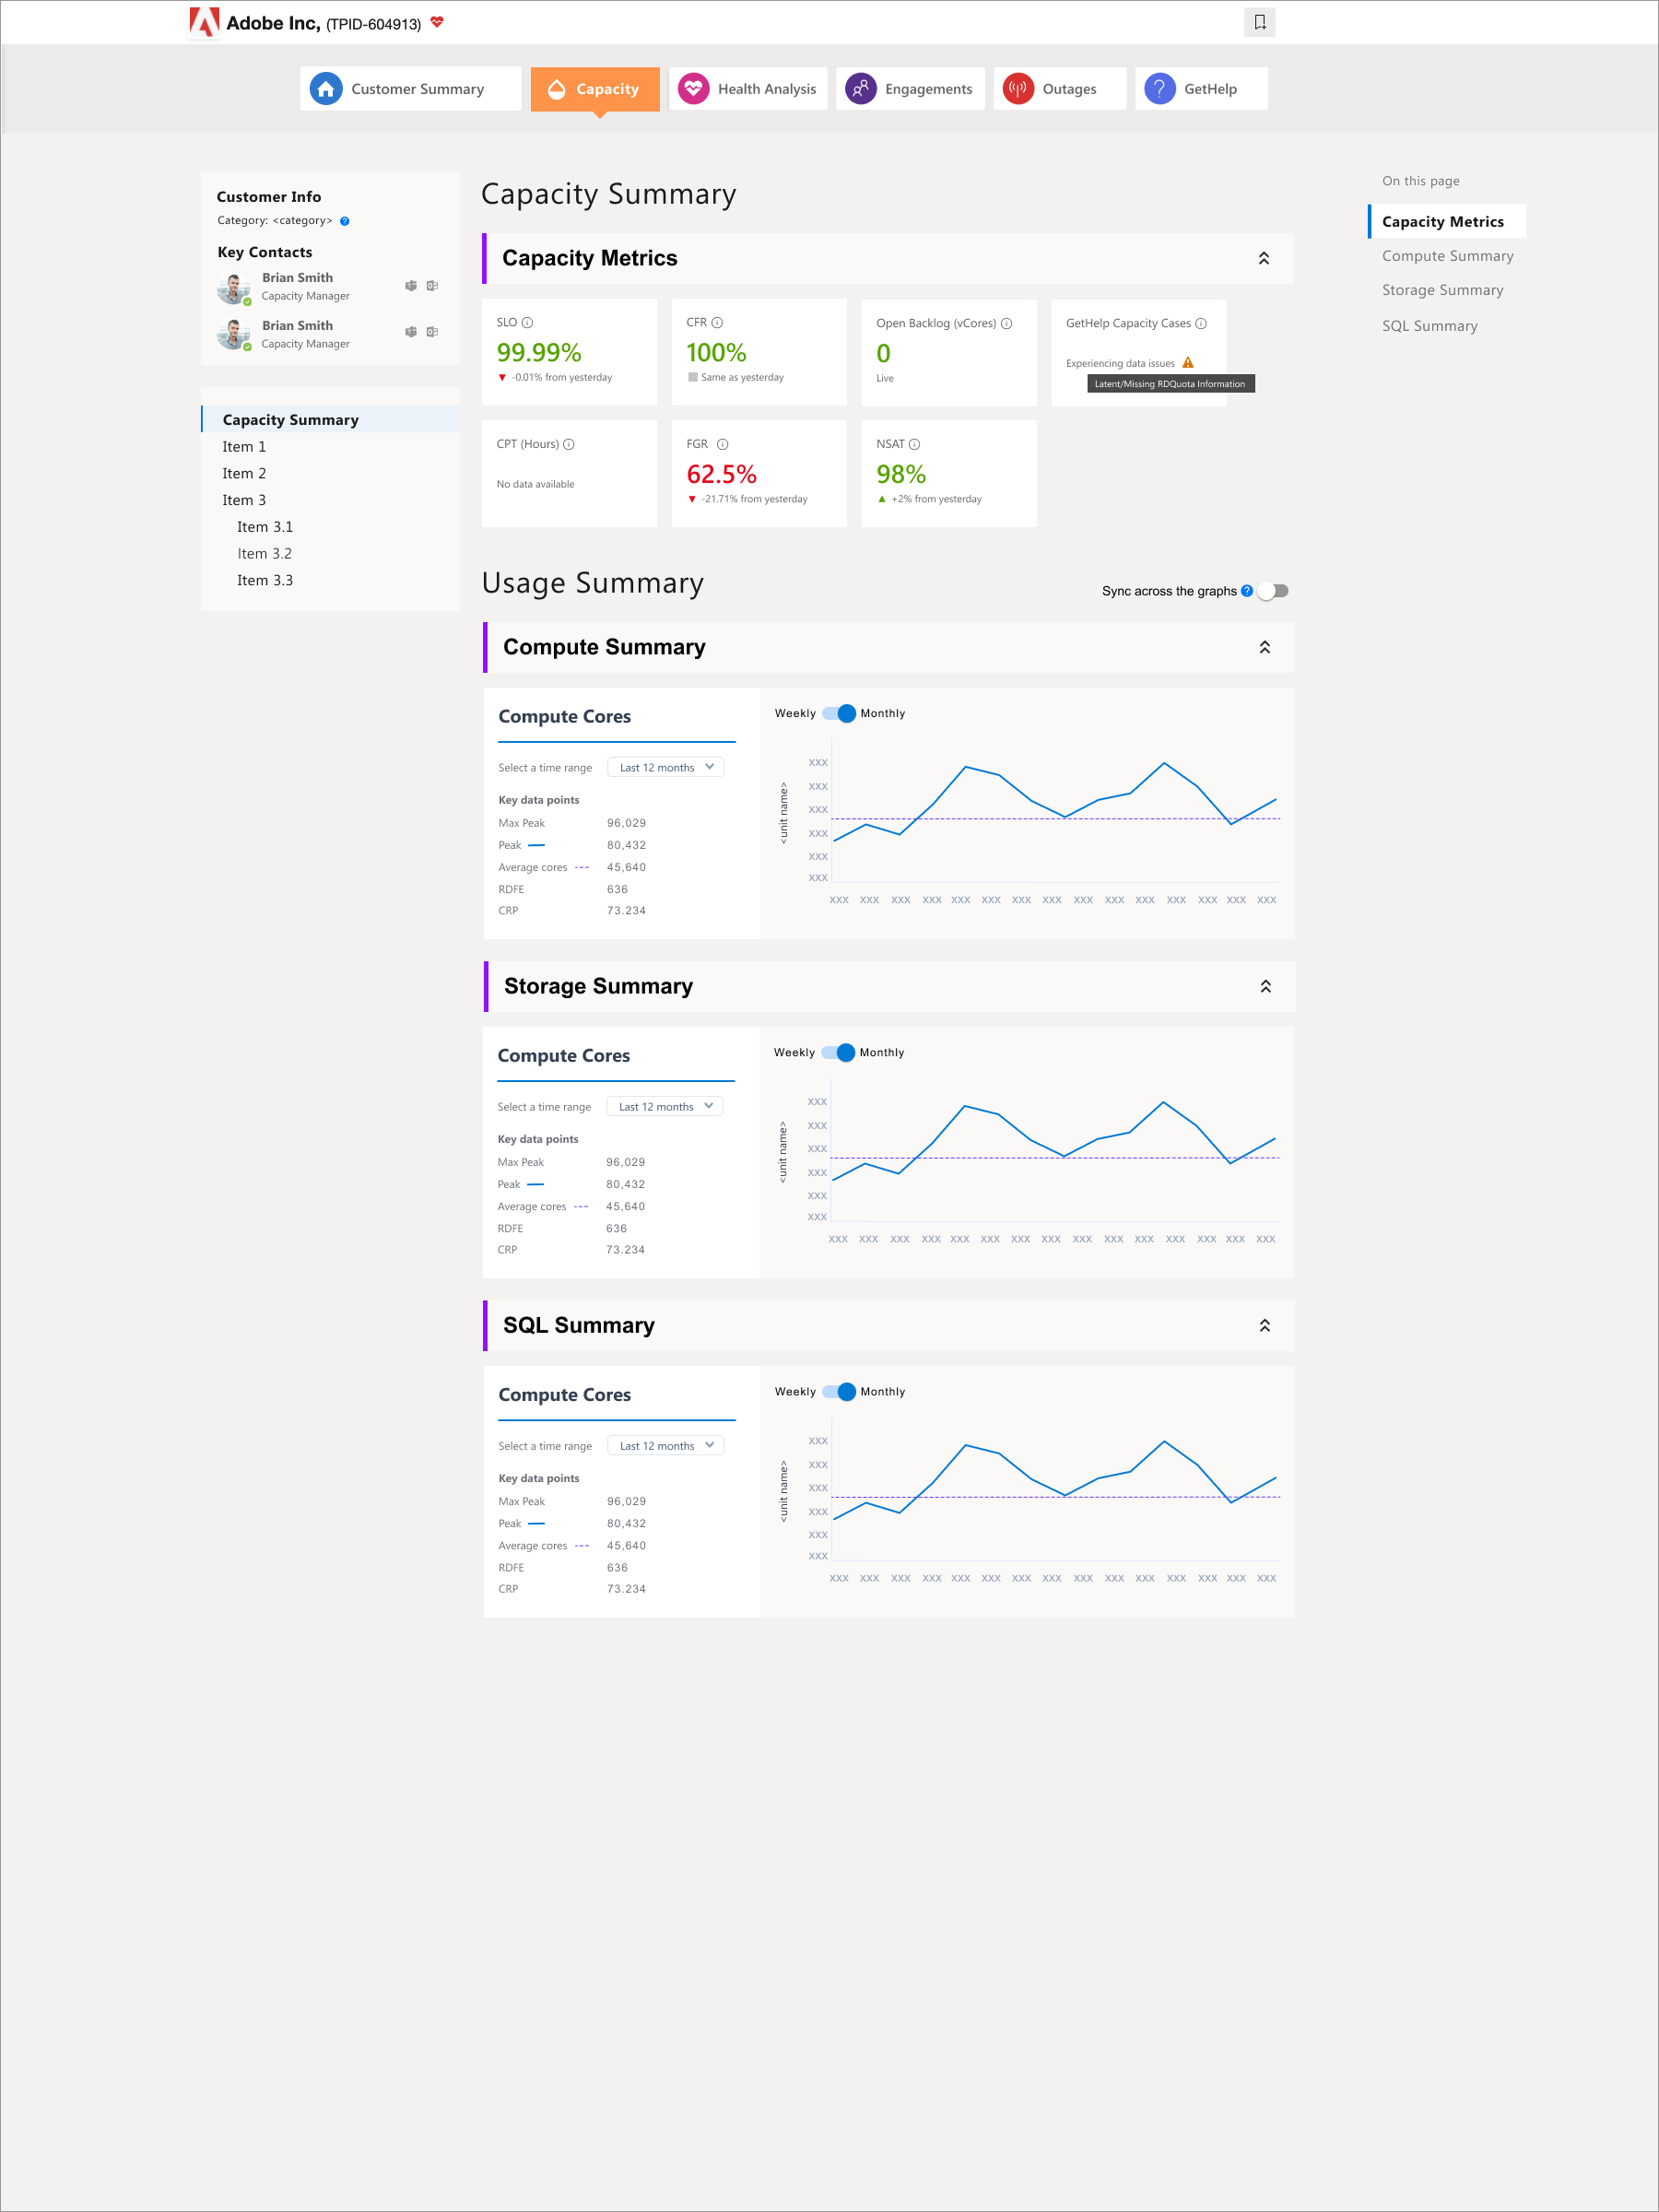
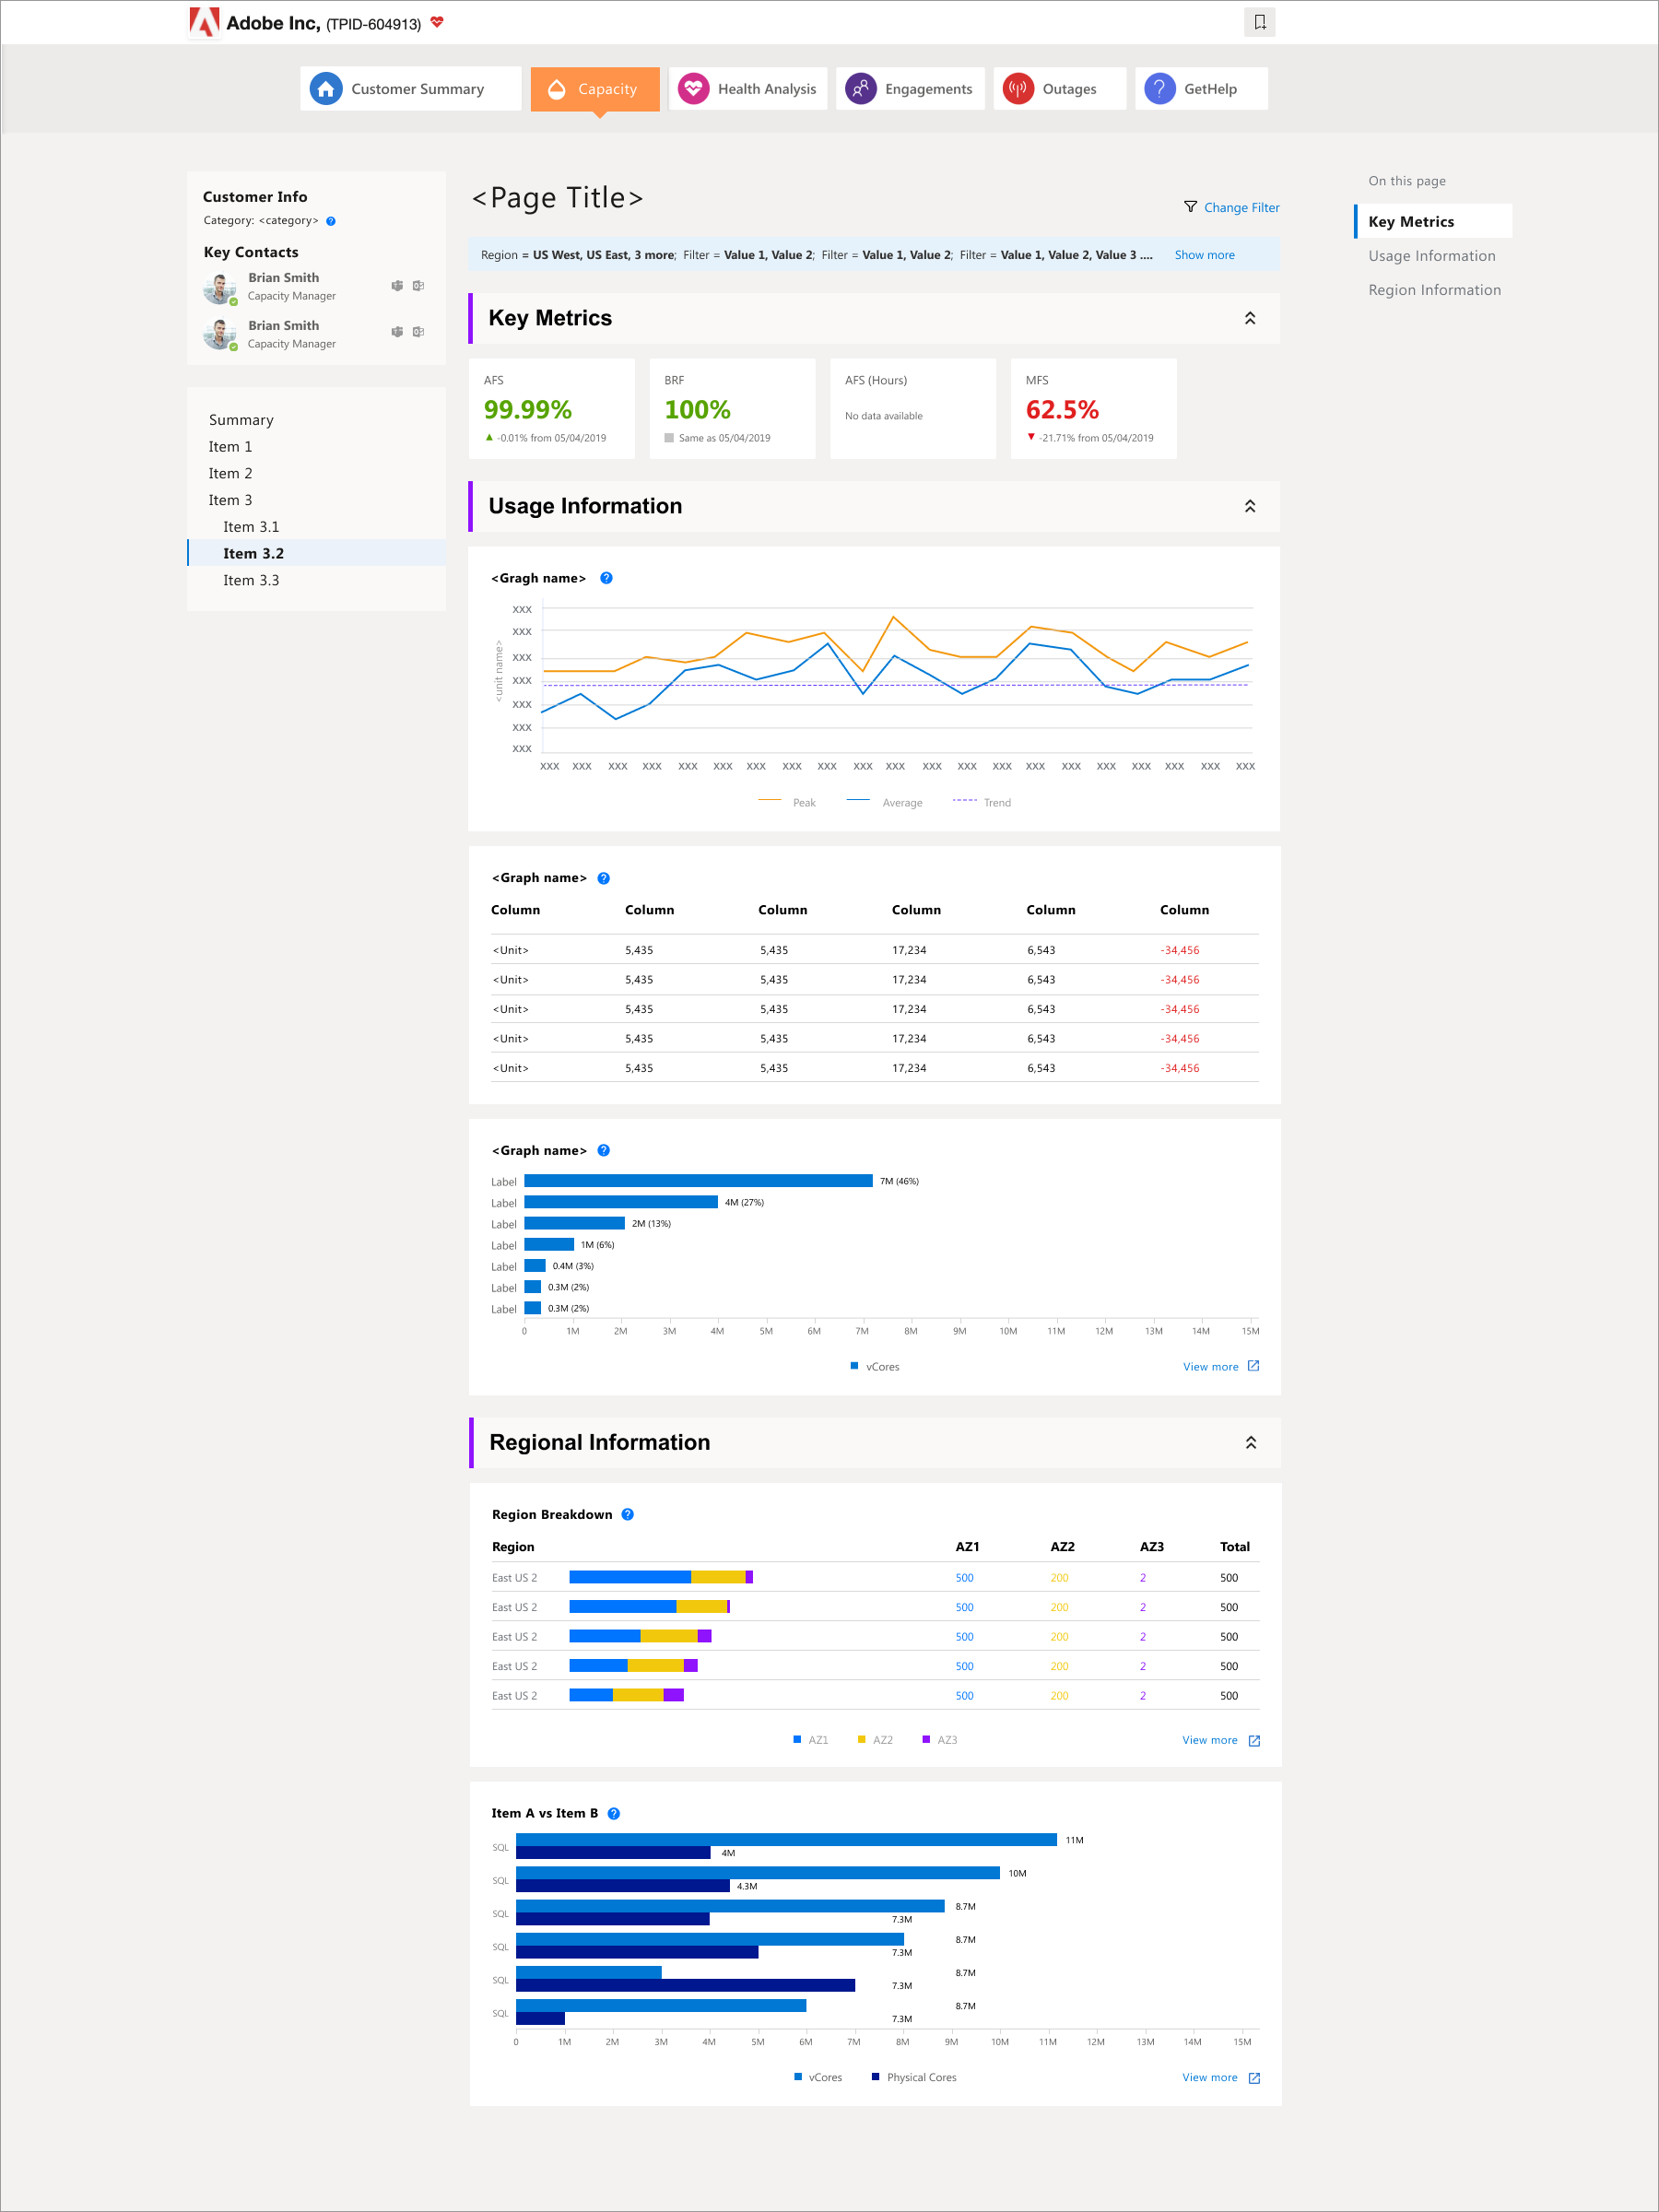
Final design
After gathering feedback from multiple teams, I created the final templates for the capacity dashboard. I worked closely with capacity managers to refine layouts through several iterations and partnered with two development teams on phased releases. By the end of 2020, we successfully launched dashboards for Capacity Summary, Compute, Storage, SQL, and CosmosDB.
Project release
The project received strong praise across the organization during the unprecedented challenges of COVID, when online capacity was under heavy stress. The initiative reduced overhead costs for premium customers, lowered operational expenses, and increased revenue by removing roadblocks that had impeded customer adoption.
Outcome
The supply chain apps I designed on the platform received strong feedback from both users and suppliers. They addressed key pain points, eliminated tedious manual work, and introduced features such as column manipulation, quick start, notifications, and bulk activities. By achieving business goals while improving user satisfaction, the platform was chosen by leadership as the strategic home for all supply chain business operations.
As of 2021, the platform had grown to:
85+
Applications
1000+
Platform users
6000+
Sessions per day
Reflection
In the supply chain space, I’ve learned to educate, advocate, and demonstrate the value of human-centered design to program managers and engineers who have less experience building customer-facing products. It has been humbling and inspiring to see more teams now reach out for foundational user research before defining requirements, and to actively participate in usability studies.
As the only design team within a large organization, we collaborate with multiple groups across diverse business areas. To support them effectively, I push myself to quickly gain domain knowledge and deeply understand their processes. Design becomes indispensable when it helps optimize workloads, connect the dots across systems, define the bigger picture, and ultimately making business operations more productive and impactful.